Text Region Detection in Historical Astronomical Diagrams
Abstract
Text detection is a crucial task in the analysis of historical documents. While datasets and benchmarks exist for text detection in manuscripts and maps, the study of text in mathematical diagrams has received little attention. To address this, we introduce a large-scale, diverse, open-access dataset of 948 historical astronomical diagrams containing 10,940 oriented polygonal text regions. Our dataset spans ten centuries (8$^{\text{th}}$ to 18$^{\text{th}}$) and seven main linguistic traditions: Arabic and Persian (115), Chinese (332), Byzantine (233), Latin (185), Hebrew (48), and Sanskrit (35). It captures a wide range of diagram styles and textual content, from symbols to multi-line paragraphs. Each text instance is annotated with ordered polygons that precisely delineate text regions and encode the reading direction. In addition, we annotated the 2,293 regions in Latin diagrams with 20 class labels. We evaluated several strong baselines on our dataset, including TESTR, DeepSolo++, and Poly-DETR, a simple extension of DINO-DETR that we design to predict ordered polygon vertices. Poly-DETR achieves state-of-the-art performance on the MTHv2 and cBAD2019 benchmarks and provides a solid, simple baseline on our dataset.
Dataset Overview
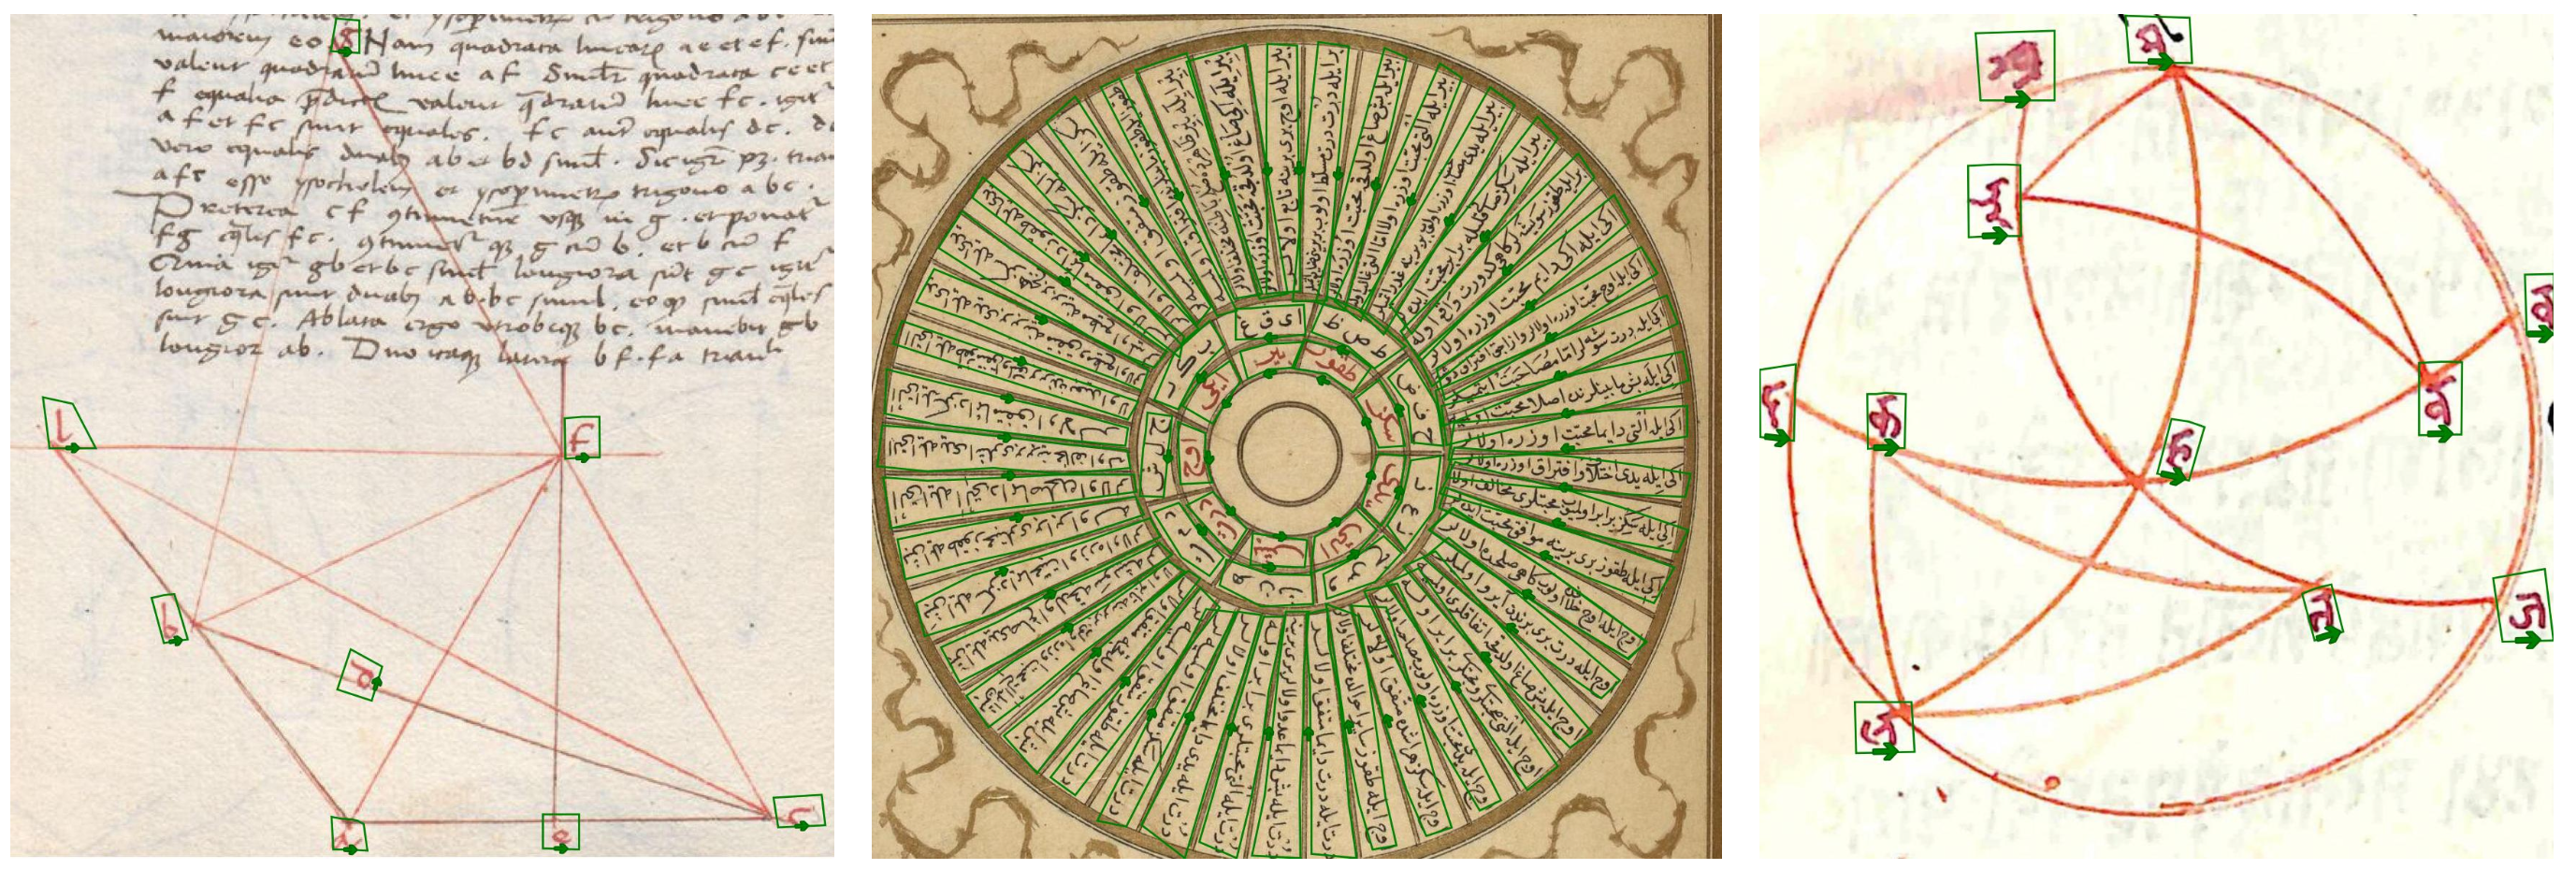
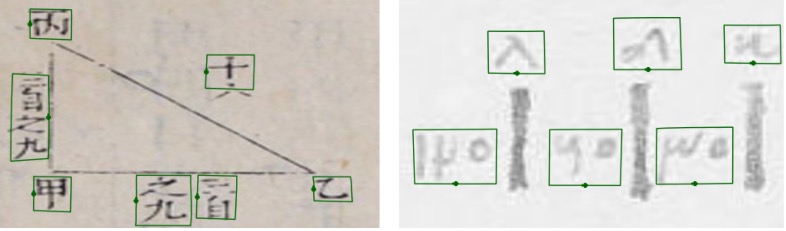
Inter-tradition diversity: Our dataset includes diagrams from many traditions (Latin, Arabic, Sanskrit, Hebrew, and Greek).
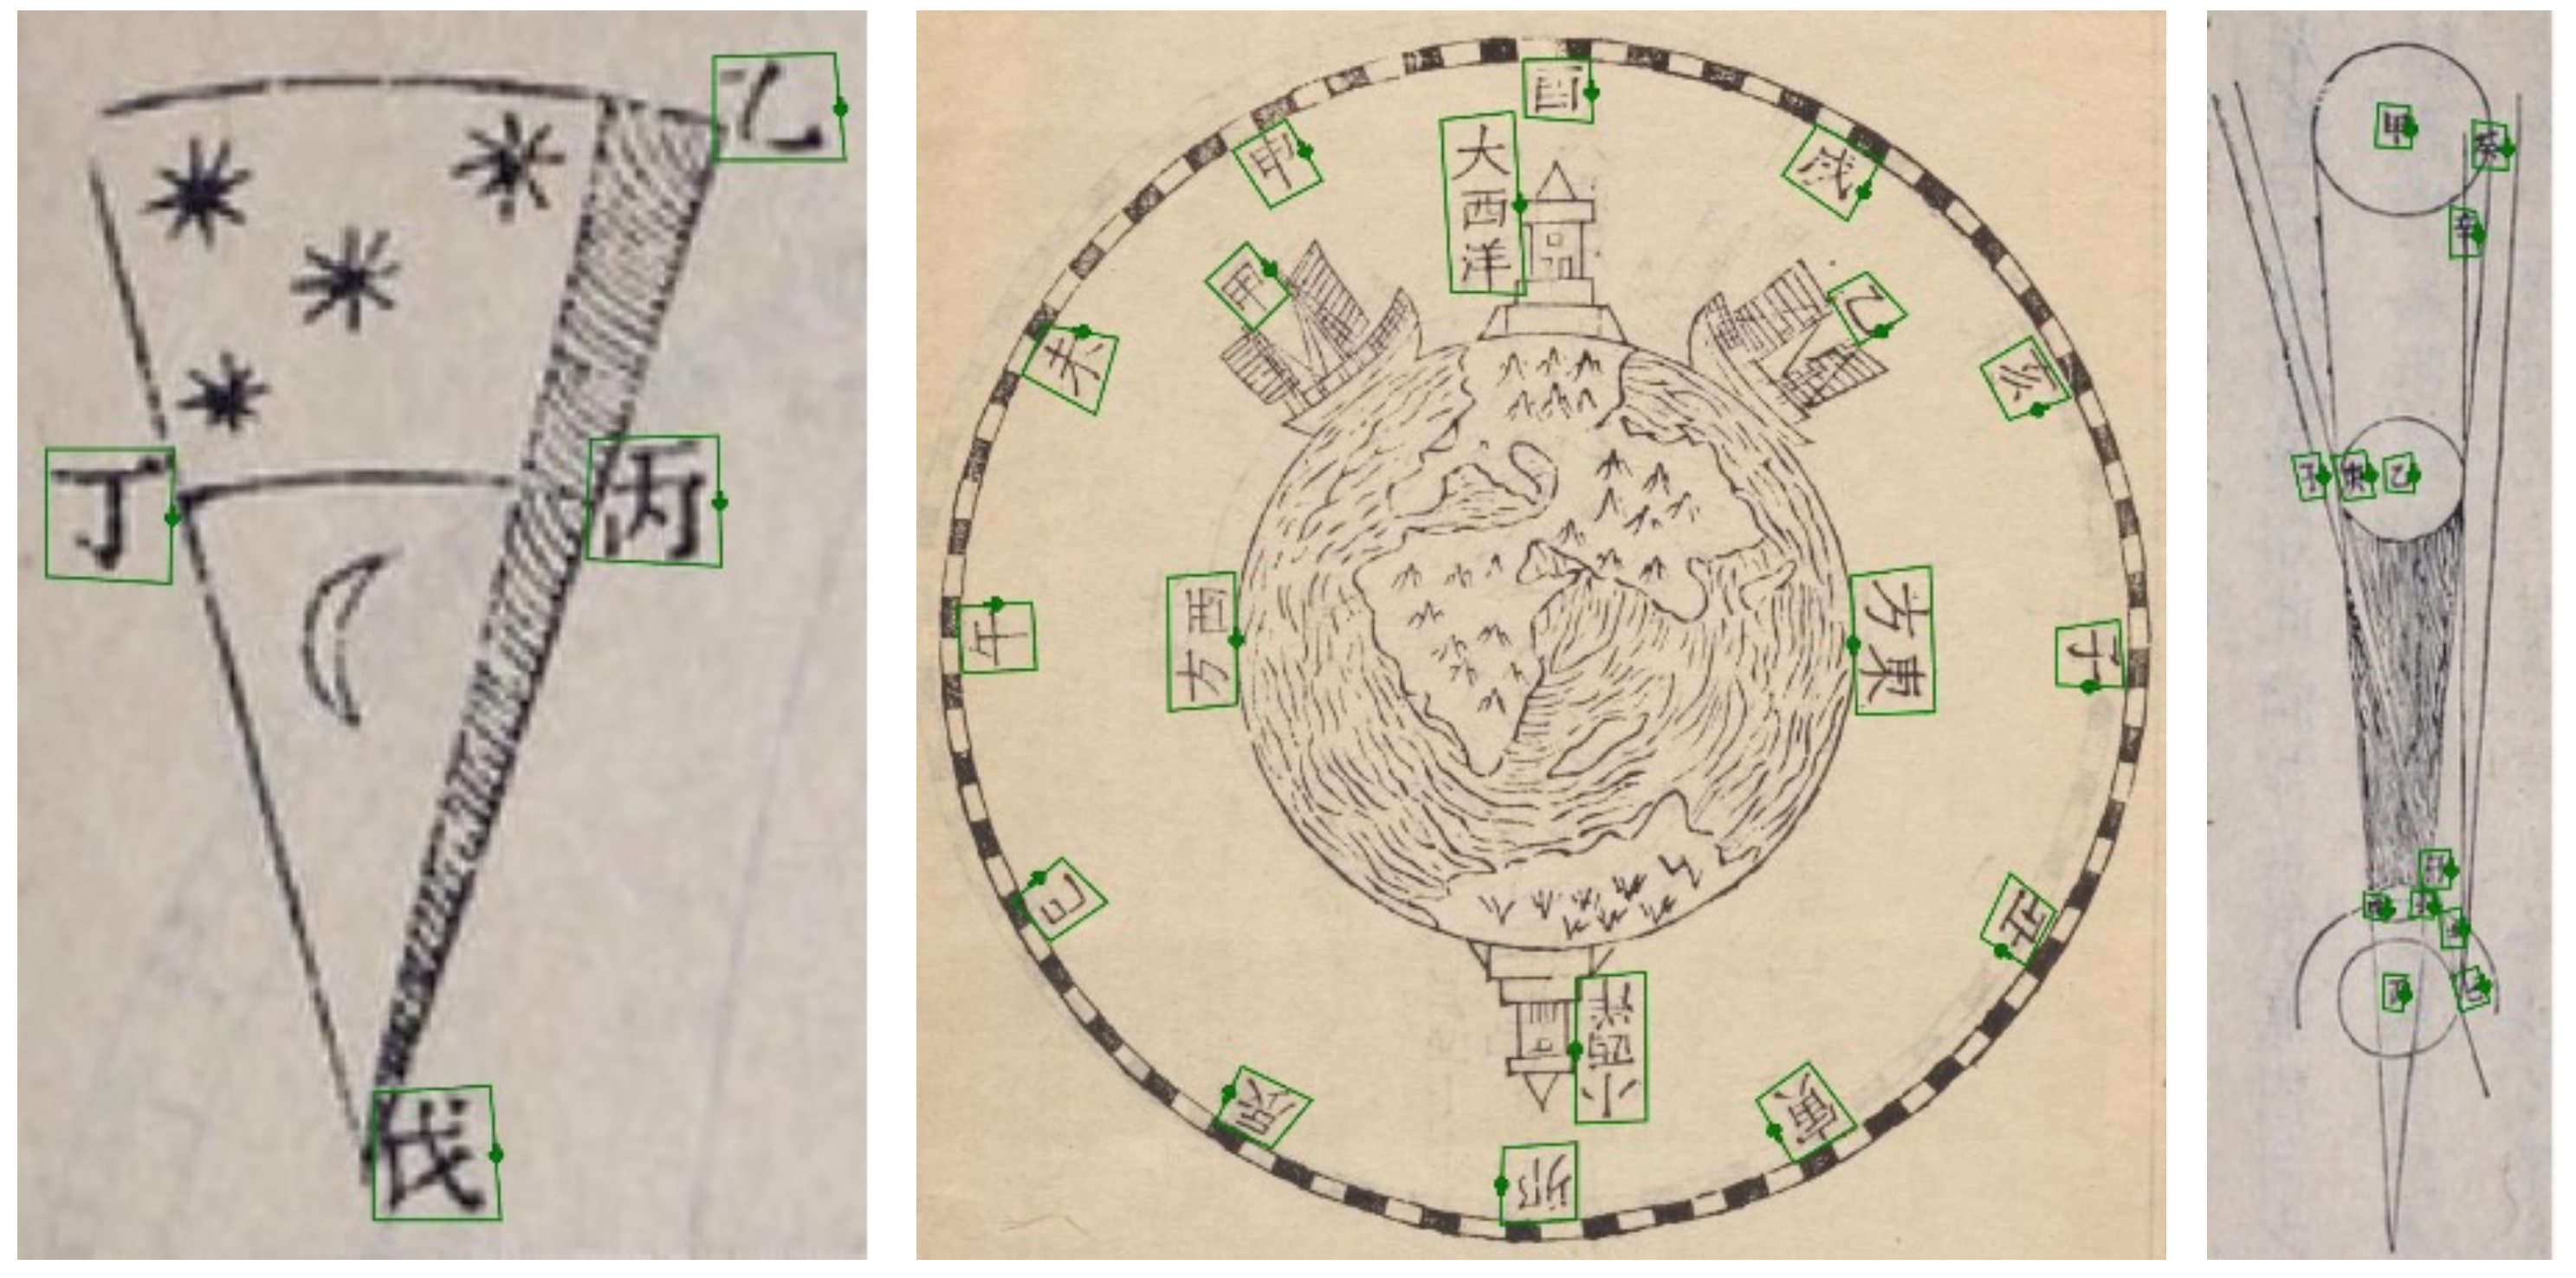
Intra-tradition diversity: Even in a single tradition (Chinese), our dataset contains high diversity.
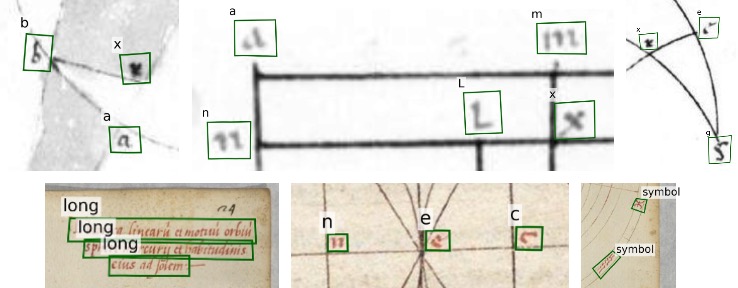
Reading Order: Expert historians annotated diagrams with ordered polygons that bound text and encode reading sequences via vertex order. Each polygon concatenates a bottom and a top line with the same number of points: the first half follows the reading order along the bottom, while the second half returns in the opposite direction along the top. This explicit ordering sets our dataset apart from other historical manuscript text line segmentation datasets, where the annotation of the reading order is mostly absent. However, it is particularly important for diagrams, where text could be written in any direction.
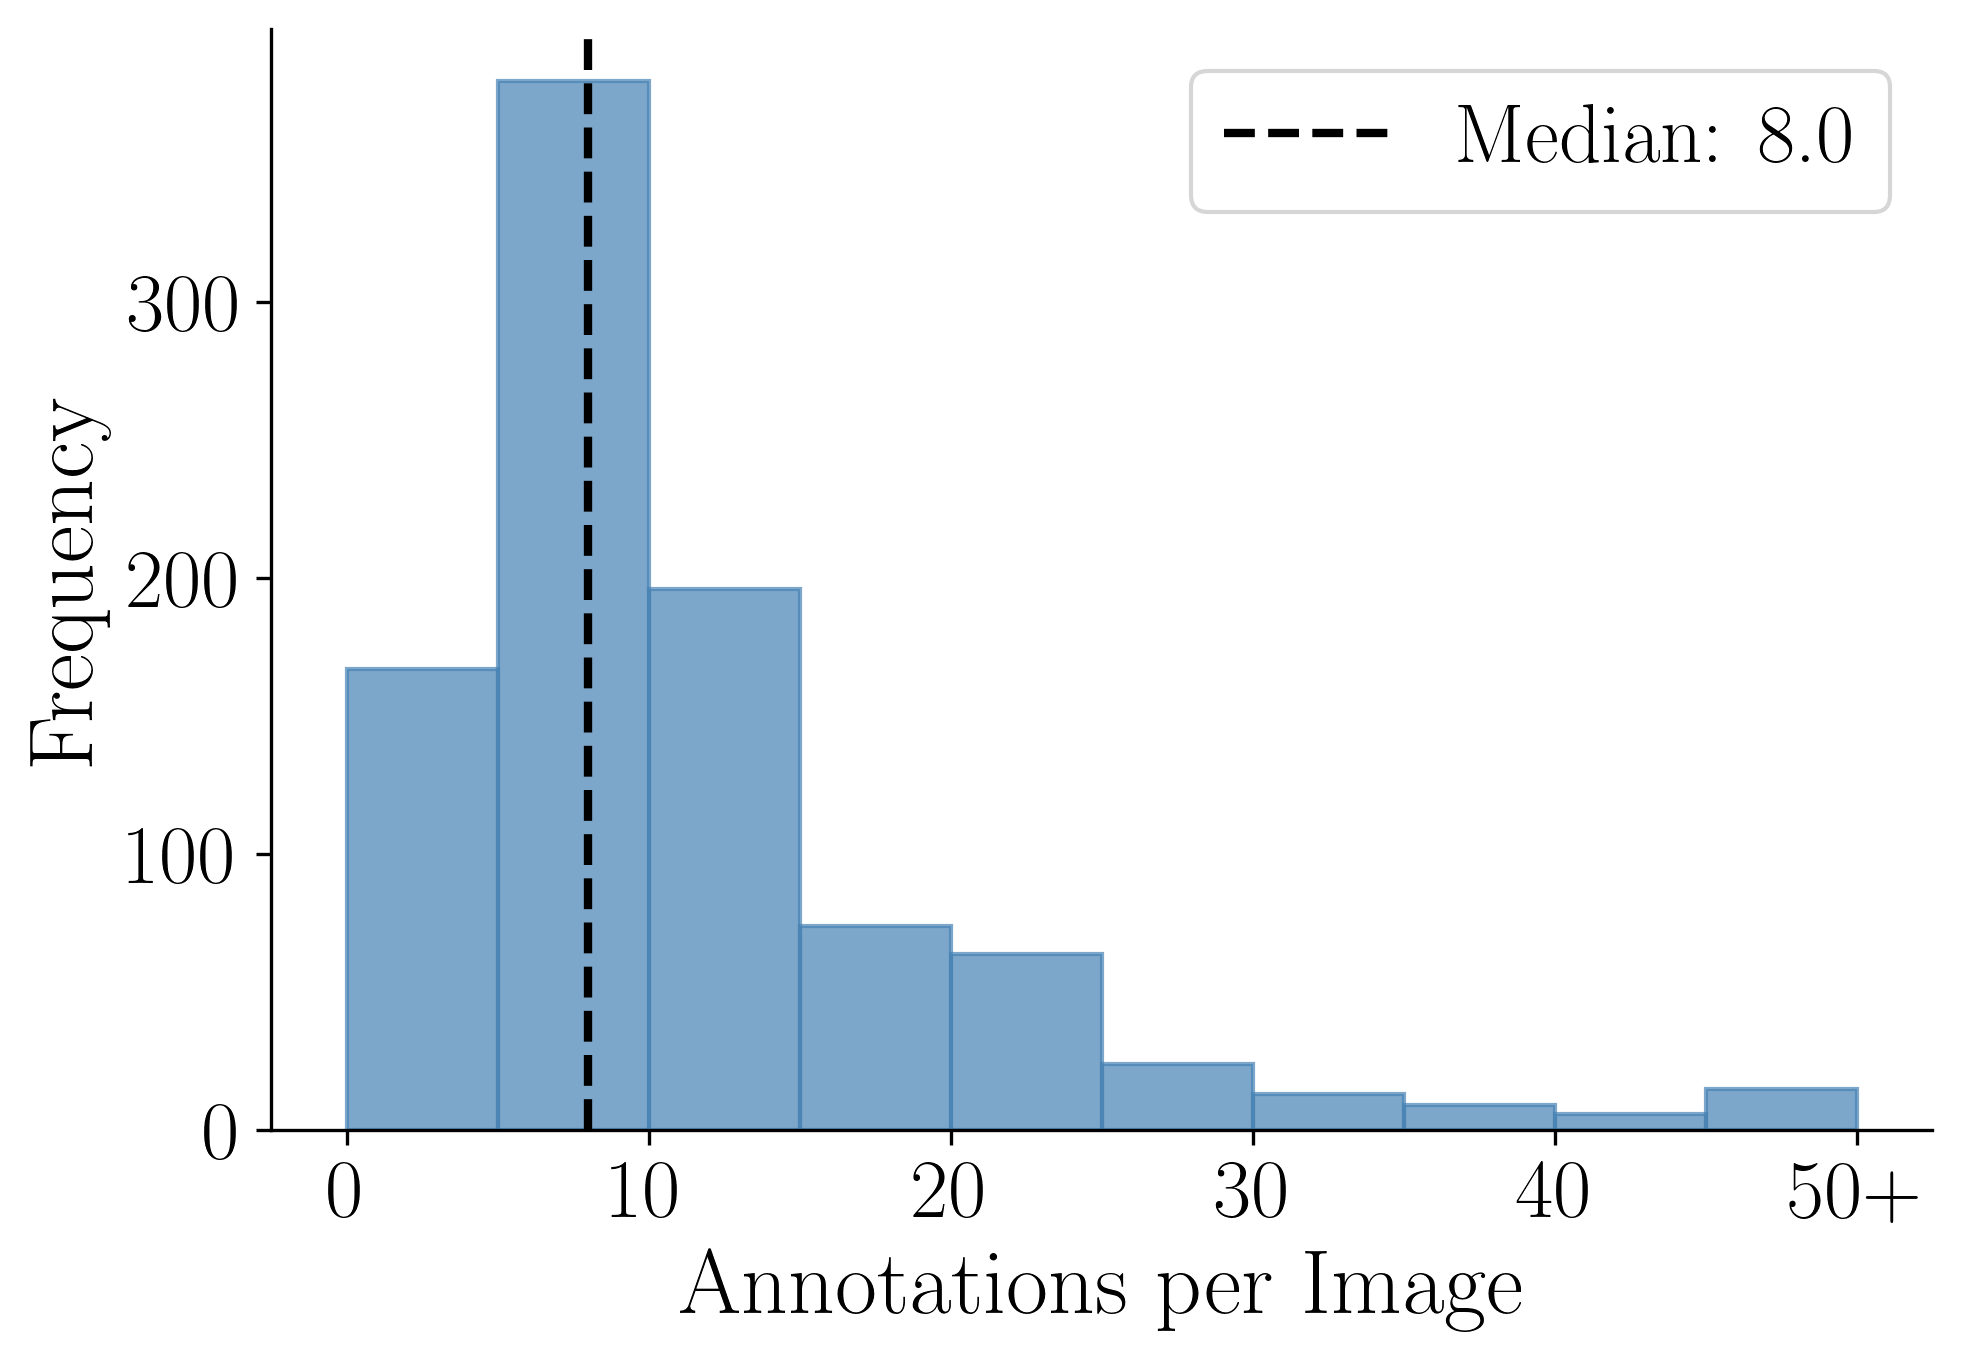
(a) Text elements per diagram.
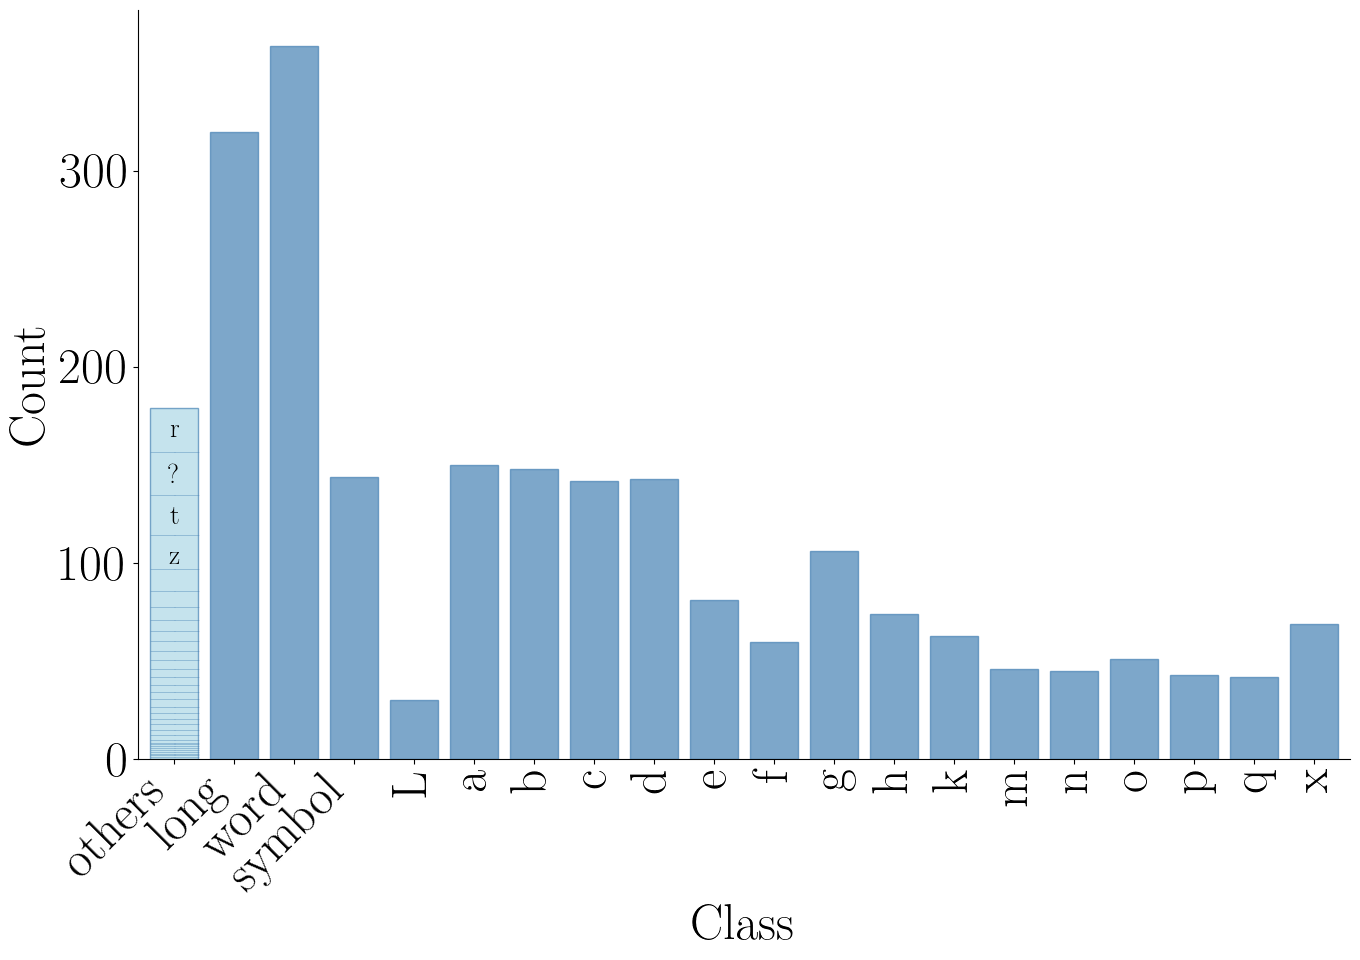
(b) Class distribution of the regions in Latin.
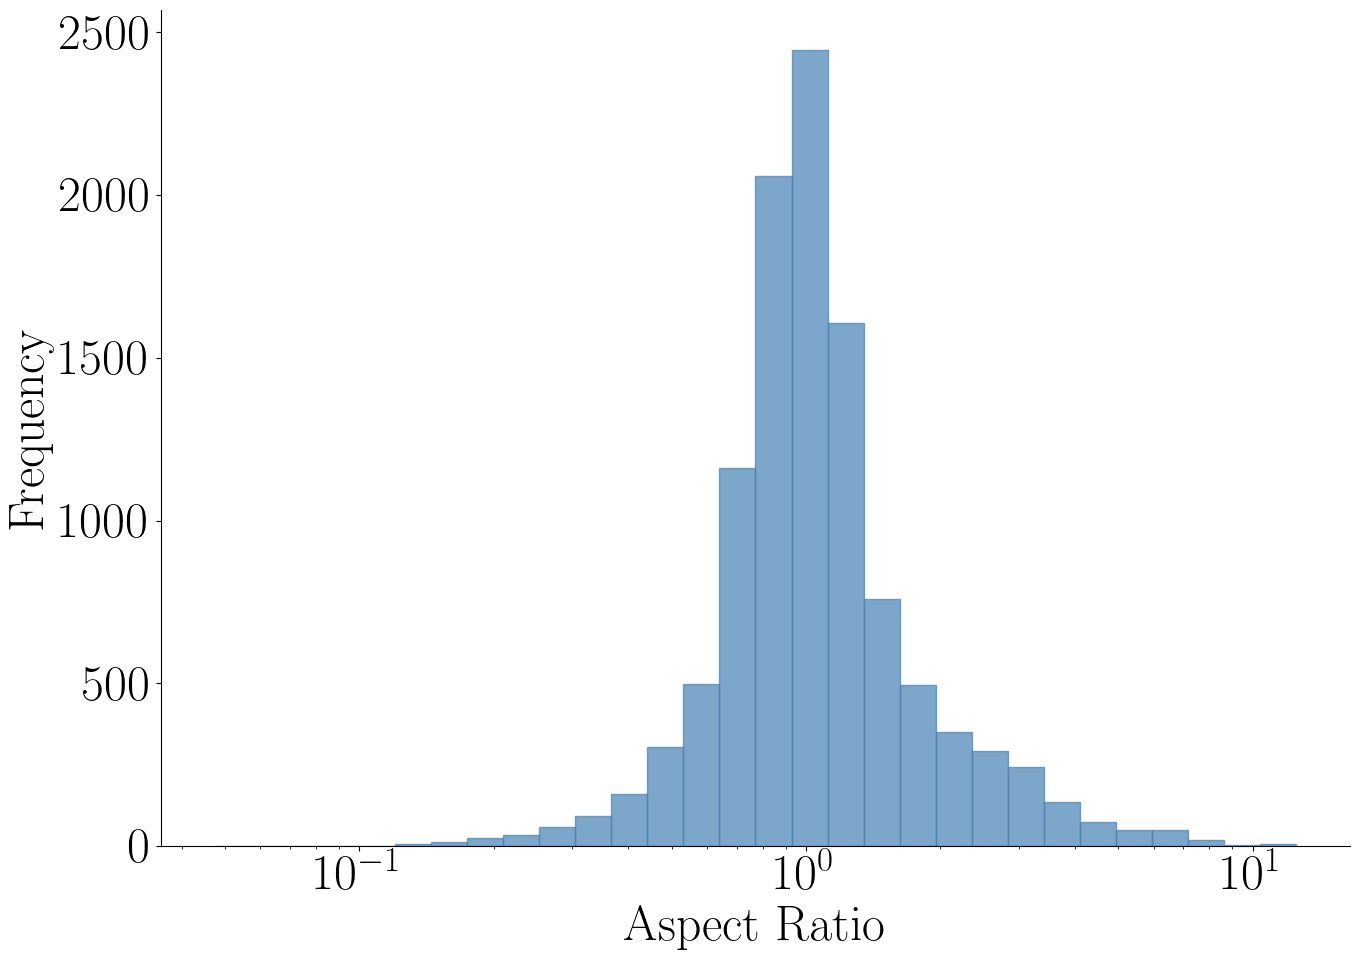
(c) Aspect ratio.
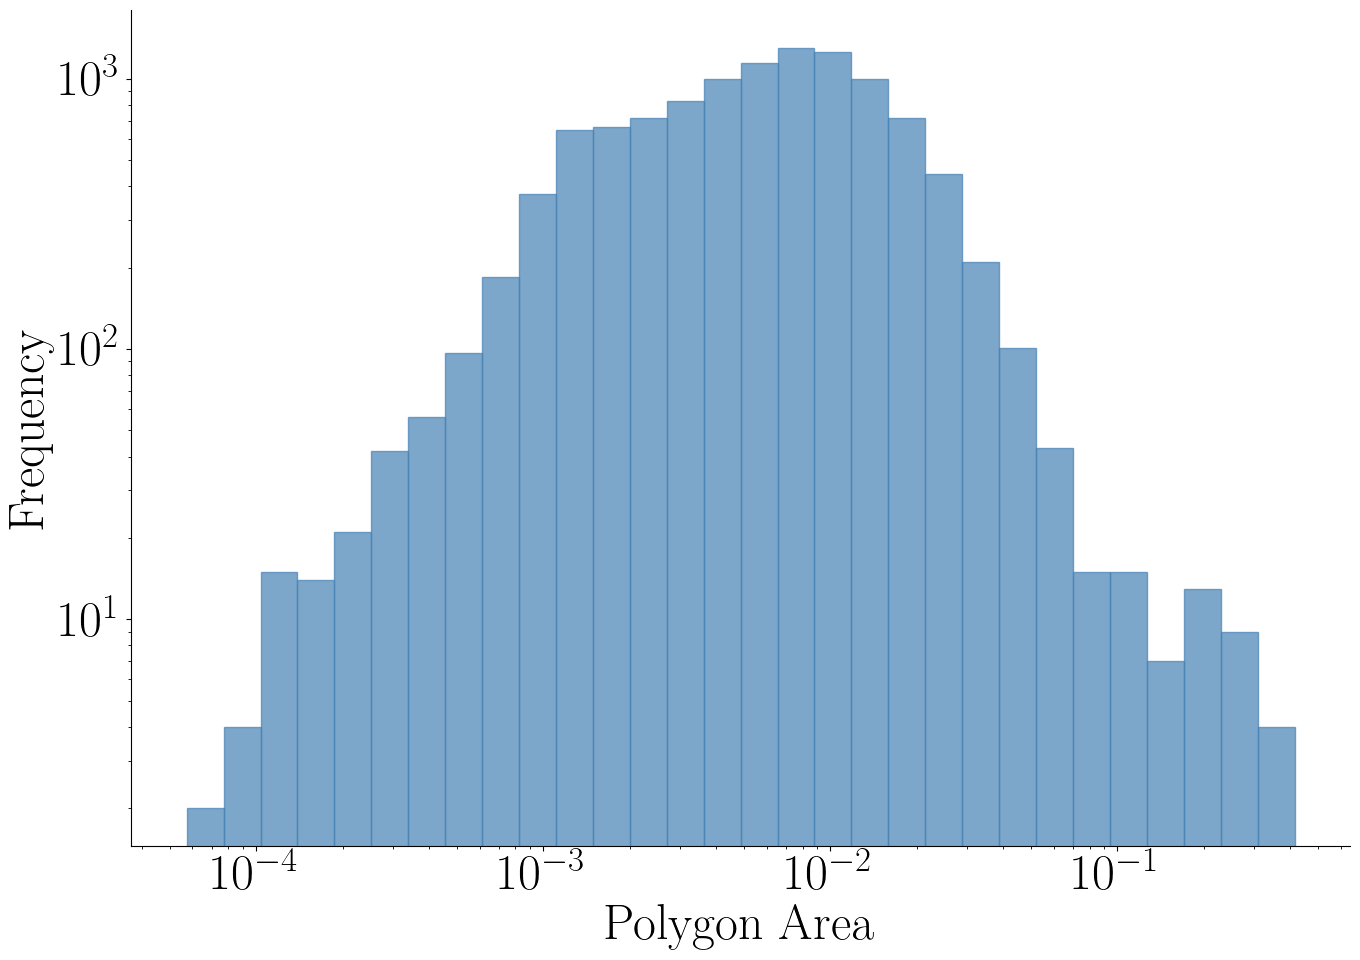
(d) Area w.r.t. image size.
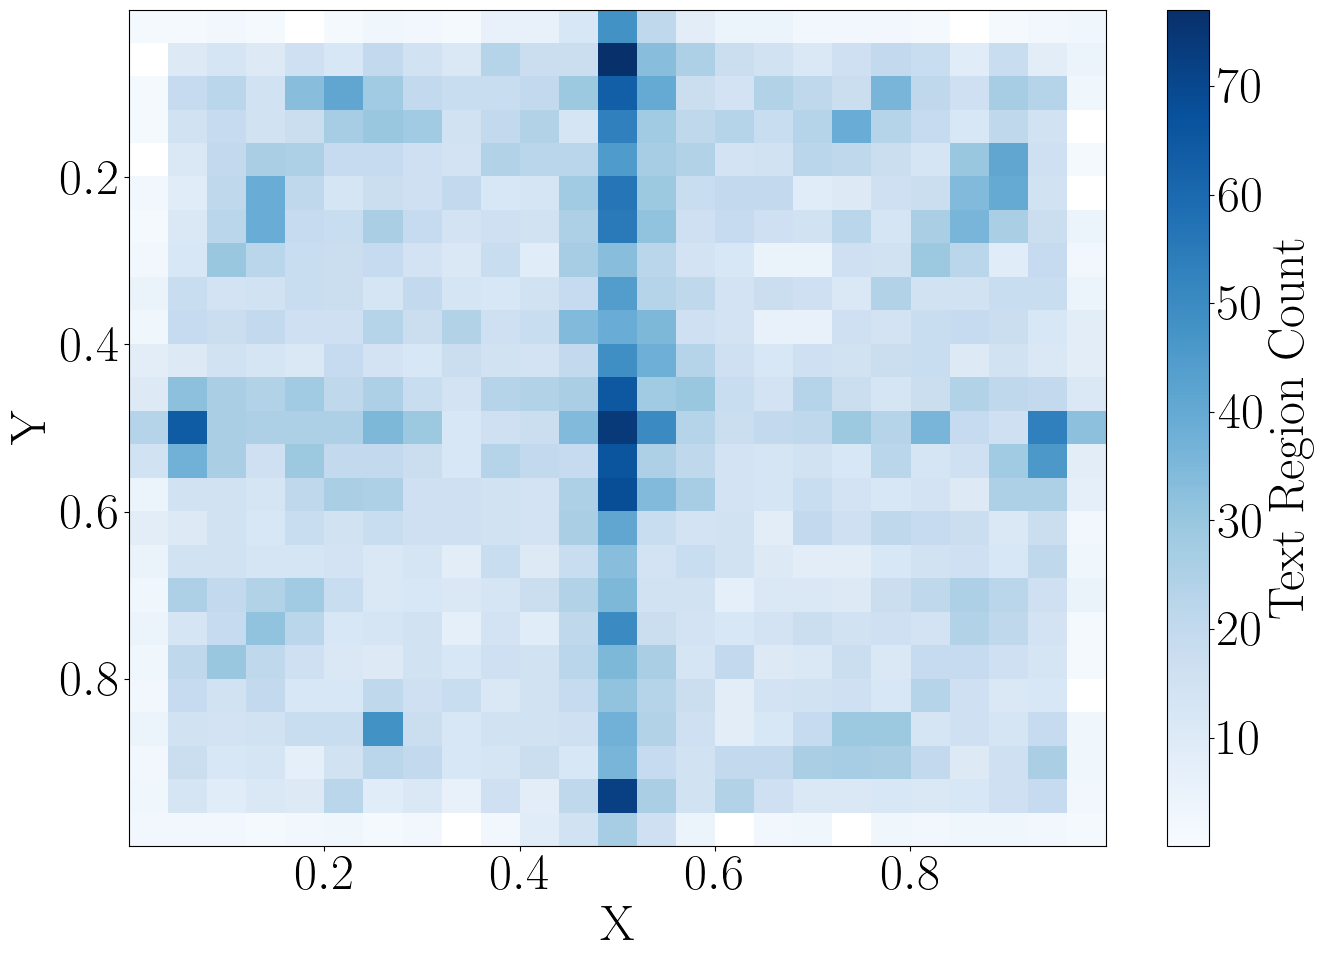
(e) Spatial distribution.
Statistics: (a) The number of text regions in the diagrams varies a lot from 1 to 207 polygons per diagram with a median of 8. (b) Our Latin diagrams' annotations are provided with text region classes. The sizes of the text regions also have high diversity, both in terms of (c) aspect ratio and (d) size compared to the full size of the diagram image. (e) visualizes the spatial distribution of the coordinates of the center of the text regions relative to the size of the image. Although there is a clear bias toward the median vertical line, which is expected, there is still a lot of diversity.
Related Work
| Dataset | Content | Access | Labels | Period | # images | Ann. format | Script(s) |
|---|---|---|---|---|---|---|---|
| cBAD2019 [Diem et al. (2019)] | 12th–20th | 3,021 | baseline points | LAT | |||
| HDRC [Simistra et al. (2019)] | unknown | 12,850 | boxes | CHI | |||
| MTHv2 [Wehong et al. (2020)] | unknown | 2,200 | boxes | CHI | |||
| M5HisDoc [[Shi et al. (2023)] | unknown | 4k | boxes | CHI | |||
| READ2016 [Toselli et al. (2018)] | 14th–19th | 30k | ord. polygons | LAT (DE) | |||
| Bentham [Sanchez et al. (2016)] | 18th-19th | 443 | ord. polygons | LAT&GRE | |||
| Saint Gall [Fisher et al. (2011)] | 9th | 60 | baseline points | LAT | |||
| Balsac [Vezina et al. (2020)] | 17th–20th | 913 | ord. polygons | LAT (FR) | |||
| BNPP [Boillet et al. (2022)] | 19th–20th | 12 | ord. polygons | LAT (FR) | |||
| HOME [Boros et al. (2020)] | 12th-15th | 43k | ord. polygons | LAT | |||
| Horae [Boillet et al. (2019)] | 5th-15th | 572 | ord. polygons | LAT | Scribble Lens [Dolfing et al. (2020)] | 16th-18th | 1k | boxes | LAT (NL) |
| Rumsey [Lin et al. (2024)] | 16th–21st | 940 | ord. polygons | LAT (EN) | |||
| FLR [Chazalon et al. (2024)] | 19th | 145 | ord. polygons | LAT (FR) | |||
| TMS [Lin et al. (2025)] | 20th | 1644 | ord. polygons | CHI | |||
| Ours | 8th–18th | 948 | ord. polygons |
Historical text detection datasets. This table outlines popular historical text detection datasets which are the most closely related to ours.
Poly-DETR & Text-line Benchmark Validation
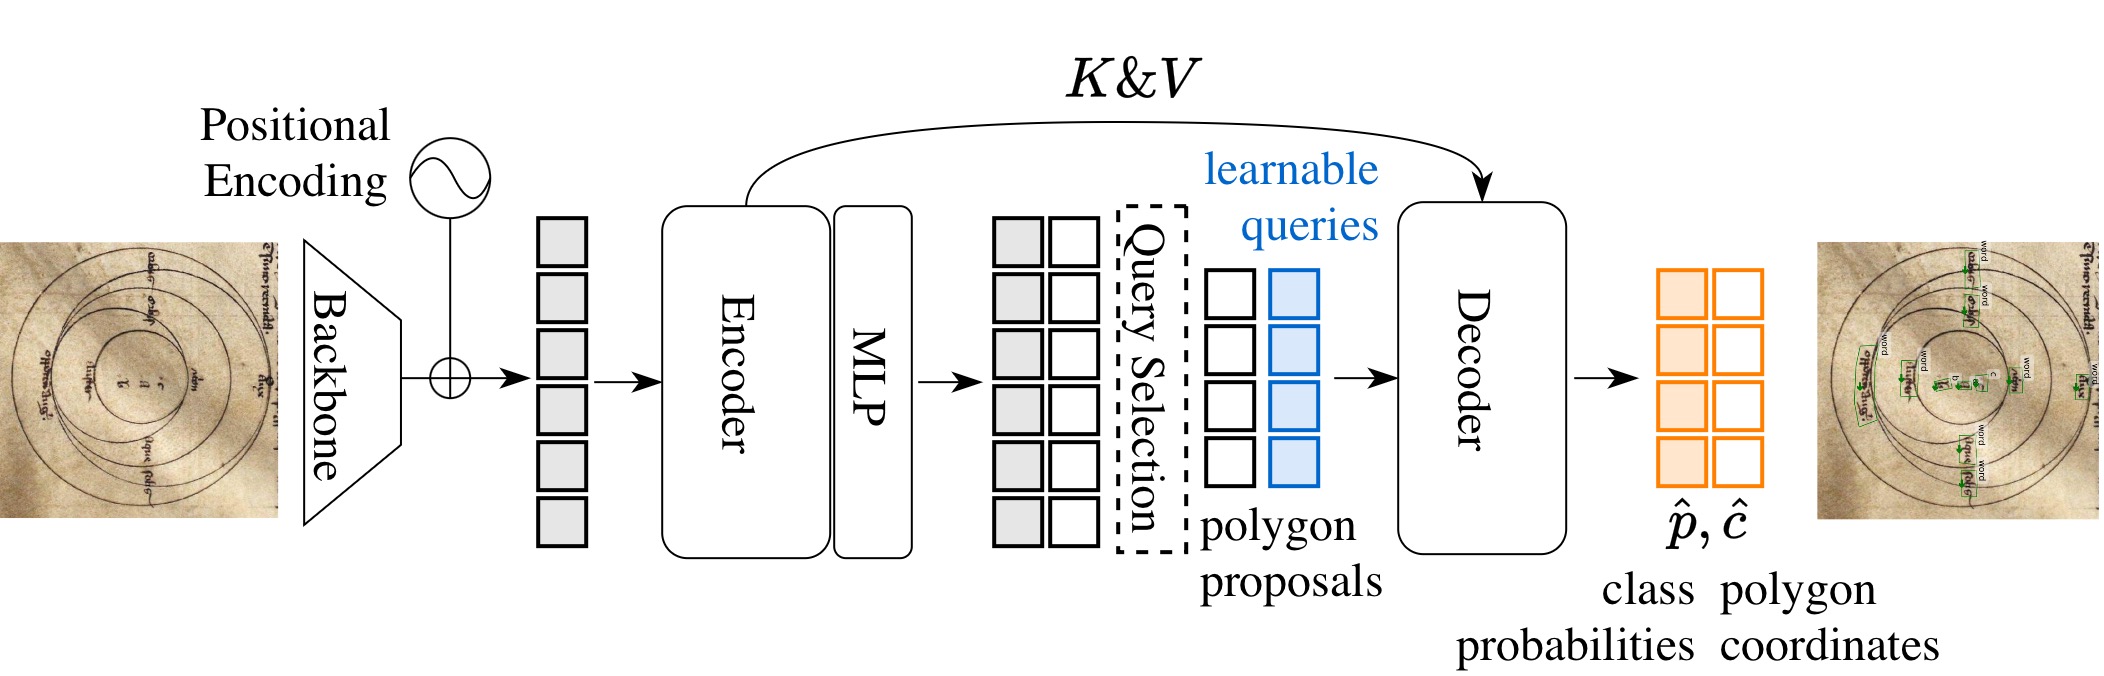
Poly-DETR. Given image features from a backbone, a transformer encoder predicts initial anchors and tokens, that are used as queries by a transformer decoder to predict, for each query token $q$, ordered polygon coordinates $\hat{\mathbf{c}}_q$ and a probability $\hat{p}_q$.
| Method | cBAD2019 | ||
|---|---|---|---|
| P | R | F1 | |
| DMRZ | 92.5 | 90.5 | 91.5 |
| Planet | 93.7 | 92.6 | 93.1 |
| docExtractor | 92.0 | 93.1 | 92.5 |
| Poly-DETR | 94.2 | 93.9 | 93.9 |
| Method | MTHv2 | HDRC* | ||||
|---|---|---|---|---|---|---|
| P | R | F1 | P | R | F1 | |
| KESAR | 93.4 | 93.1 | 93.2 | – | – | – |
| Mask R-CNN | 98.2 | 96.0 | 97.1 | 96.6 | 96.2 | 96.4 |
| Deformable DETR | 97.9 | 94.6 | 96.3 | 94.4 | 95.7 | 94.6 |
| PAN | 97.2 | 93.1 | 95.1 | 95.1 | 92.8 | 94.0 |
| OBD | 97.8 | 97.3 | 97.6 | 94.6 | 97.0 | 95.7 |
| DTDT | 97.9 | 97.9 | 97.9 | 96.9 | 96.4 | 96.6 |
| Poly-DETR | 98.4 | 98.5 | 98.4 | 96.7 | 96.5 | 96.6 |
Quantitative results for text line detection on the cBAD2019 [Diem et al. (2019)], MTHv2 [Wehong et al. (2020)], and HDCR19 [Simistra et al. (2019)] datasets. (*) HDRC lacks an official test split, making results incomparable; we report 5-fold cross-validation. P: Precision, R: Recall.
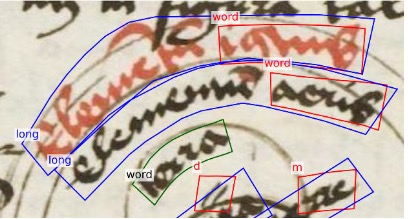
Task 1: Class-Agnostic Text Region Detection
(a-i)
(a-ii)
(a-iii)
(b)
(c)
(d)
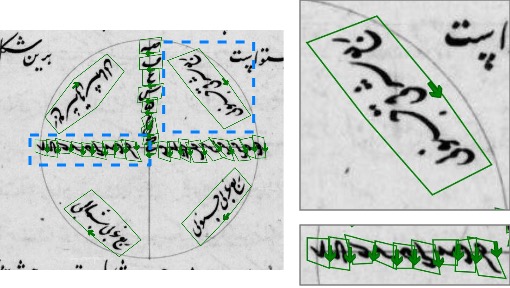
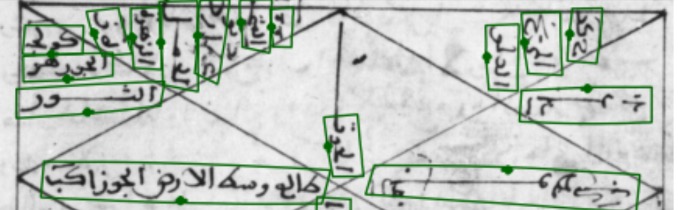
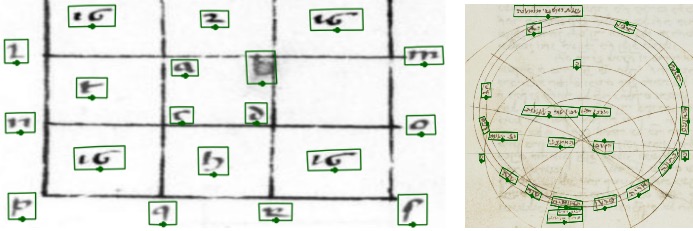
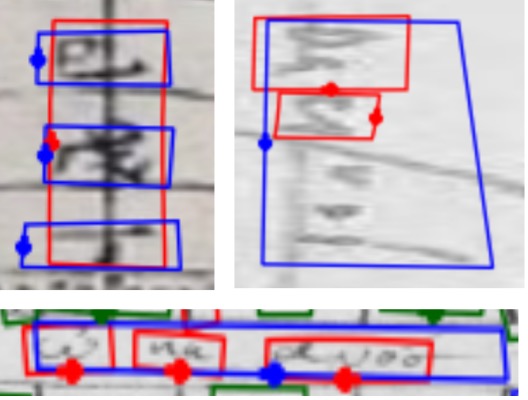
Qualitative text detection on historical astronomical diagrams. Examples illustrating (a-{i,ii,iii}) typical good predictions and (b-d) the most common error modes of our method on astronomical diagrams. True positives (TP), false positives (FP), and false negatives (FN) are shown in green, red, and blue, respectively. Failures include (b) some text being incorrectly split into multiple detections, (c) detecting text that's not part of the diagram that should be ignored, and (d) detecting text-like patterns within the drawings as actual text.
| Method | pt. | ft. | F1 | F1-O | AP50 | AP50-O |
|---|---|---|---|---|---|---|
| TESTR [Zhang et al. (2022)] | scene text | ✓ | 80.4 | 71.1 | 82.4 | 68.3 |
| ~ w/o finetuning | scene text | 30.6 | 9.7 | 14.8 | 0.0 | |
| ~ w/o pretraining | none | ✓ | 47.4 | 37.6 | 36.2 | 24.8 |
| Poly-DETR | synthetic | ✓ | 79.7 | 69.1 | 76.6 | 61.9 |
| ~ w/o finetuning | synthetic | 39.8 | 10.9 | 28.2 | 2.7 | |
| ~ w/o pretraining | none | ✓ | 73.2 | 68.6 | 70.3 | 62.1 |
| ~ w/ 4 points | synthetic | ✓ | 72.1 | 48.9 | 67.8 | 34.3 |
| DeepSolo++ [Ye et al. (2023)] | scene text | ✓ | 80.0 | 61.7 | 75.6 | 49.4 |
| ~ w/o finetuning | scene text | 24.3 | 6.4 | 13.8 | 1.3 | |
| ~ w/o pretraining | none | ✓ | 0.0 | 0.0 | 0.0 | 0.0 |
Quantitative results for class-agnostic text detection. pt.: pretraining, ft.: finetuning, F1-O: F1 score with correct reading order, AP50-O: AP50 with correct reading order.
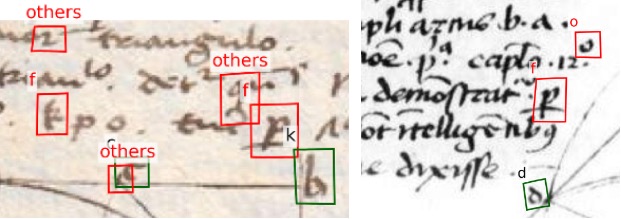
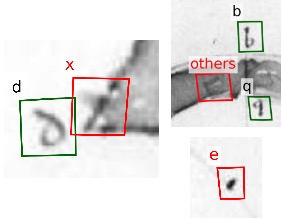
Task 2: Class-Aware Text Region Detection
(a)
(b)
(c)
(d)
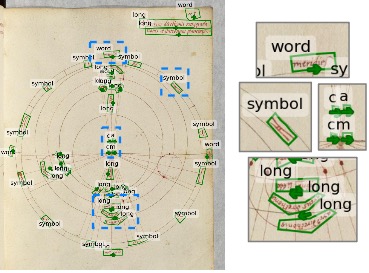
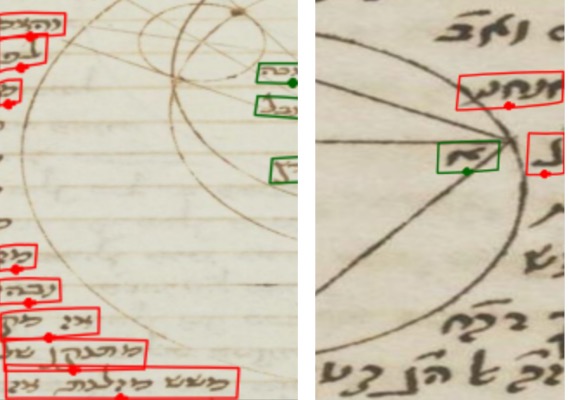
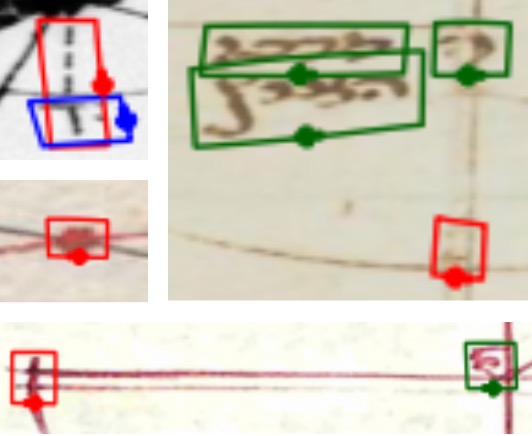
Qualitative results for class-aware text detection on historical astronomical diagrams. Examples illustrating (a) typical good predictions and (b-d) the most common error modes of our method on astronomical diagrams. True positives (TP), false positives (FP), and false negatives (FN) are shown in green, red, and blue, respectively. Failures include (b) splitting text regions into smaller categories, (c) detecting text that is not part of the diagram, and (d) ambiguities due to inking and text-like patterns.
| Method | pt. | ft. | mF1 | mAP50 |
|---|---|---|---|---|
| TESTR [Zhang et al. (2022)] | scene text | ✓ | 69.4 | 68.3 |
| ~ w/o finetuning | scene text | 1.9 | 0.9 | |
| Poly-DETR | synthetic | ✓ | 64.4 | 63.4 |
| ~ w/o finetuning | synthetic | 6.9 | 5.9 | |
| ~ w/o pretraining | none | ✓ | 34.2 | 33.4 |
Quantitative results for class-aware text detection. pt.: pretraining, ft.: finetuning, mF1: mean F1 score, mAP50: mean AP50.
BibTeX
@article{baltaci2026text,
        title={Text region detection in historical astronomical diagrams},
        author={Baltaci, Zeynep Sonat and Baena, Raphael and Meng, Fei and Norindr, Somkeo and Somer, Florence and Husson, Matthieu and Aubry, Mathieu},
        booktitle={ICDAR},
        year={2026}
    }
Acknowledgement
This work was funded by the ANR project EIDA ANR-22-CE38-0014, the ANR project VHS ANR-21-CE38-0008, and the ERC project DISCOVER funded by the European Union's Horizon Europe Research and Innovation program under grant agreement No. 101076028. This work was granted access to the HPC resources of IDRIS under the allocation AD010614956R1 and AD011015222 made by GENCI. The authors would like to thank the many historians and computer vision researchers that contributed to the development of the dataset: Eleonora Andriani (Sphaera project, Max Planck Institute for the History of Sciences, Berlin), Ji Chen, Samuel Guessner, Divna Manolova, Scott Trigg (EIDA project), Malamatenia Vlachou Efstathiou, Léore Bensabath (ENPC), and Vidal Attias (CEA).